Loading the PSL indices, and comparing them against package calculated anomalies
Load Libraries
[1]:
# Convenient jupyter setup
%load_ext autoreload
%autoreload 2
%config IPCompleter.greedy=True
[2]:
import matplotlib.pyplot as plt
from src.visualisation.comp_seq import comp_seq
from src.visualisation.pairplot import pairplot
from src.data_loading.psl import get_psl_indices, get_ersstv5
from src.xr_utils import can_coords, fix_calendar, sel
from src.metrics import nino_calculate
from src.plot_utils import ps_defaults
ps_defaults(dpi=200)
Download PSL indices
[3]:
# Dowload the PSL indices from the website
psl_ds = get_psl_indices()
psl_df = psl_ds.to_dataframe()
Inspect PSL indices
[4]:
# Download the PSL indices
psl_ds
[4]:
<xarray.Dataset>
Dimensions:  (time: 888)
Coordinates:
  * time     (time) datetime64[ns] 1948-01-15 1948-02-15 ... 2021-12-15
Data variables:
    nino1+2  (time) float32 nan nan nan nan nan nan ... -0.3 -0.67 -0.79 nan nan
    nino3    (time) float32 nan nan nan nan nan ... -0.46 -0.44 -0.75 nan nan
    nino3.4  (time) float32 nan nan nan nan nan ... -0.51 -0.56 -0.95 nan nan
    nino4    (time) float32 nan nan nan nan nan ... -0.26 -0.53 -0.73 nan nan
    oni      (time) float32 nan nan nan nan nan nan ... -0.48 -0.67 nan nan nan
    tni      (time) float32 0.454 0.047 -0.135 -0.469 -0.95 ... nan nan nan nan
    soi      (time) float32 nan nan nan nan nan nan ... 2.3 1.0 1.3 1.2 nan nan
    meiv2    (time) float32 nan nan nan nan nan ... -1.34 -1.41 -1.47 nan nan
    best     (time) float32 0.26 0.43 0.72 0.21 0.24 ... -0.7 -1.04 nan nan
    hurr     (time) float32 0.0 0.0 0.0 0.0 0.0 0.0 ... nan nan nan nan nan nan
    prcp     (time) float32 nan nan nan nan nan ... -1.254 -0.5527 nan nan
    pacwarm  (time) float32 -0.622 -0.549 -0.716 -0.609 ... 0.401 0.449 nan nan
xarray.Dataset
- time: 888
- time(time)datetime64[ns]1948-01-15 ... 2021-12-15
array(['1948-01-15T00:00:00.000000000', '1948-02-15T00:00:00.000000000',
       '1948-03-15T00:00:00.000000000', ..., '2021-10-15T00:00:00.000000000',
       '2021-11-15T00:00:00.000000000', '2021-12-15T00:00:00.000000000'],
      dtype='datetime64[ns]')
- nino1+2(time)float32nan nan nan nan ... -0.79 nan nan
- name :
- nino1+2
- long_name :
- NINO1+2
- units :
- dimensionless
- description :
- Nino1+2 Annom Index using ersstv5 from CPC https://psl.noaa.gov/data/climateindices/list/for info
array([ nan, nan, nan, ..., -0.79, nan, nan], dtype=float32)
- nino3(time)float32nan nan nan nan ... -0.75 nan nan
- name :
- nino3
- long_name :
- NINO3
- units :
- dimensionless
- description :
- Nino 3 Anom Index using ersstv5 from CPC https://psl.noaa.gov/data/climateindices/list/for info
array([ nan, nan, nan, ..., -0.75, nan, nan], dtype=float32)
- nino3.4(time)float32nan nan nan nan ... -0.95 nan nan
- name :
- nino3.4
- long_name :
- NINO3.4
- units :
- dimensionless
- description :
- Nino Anom 3.4 Index using ersstv5 from CPC https://psl.noaa.gov/data/climateindices/list/for info
array([ nan, nan, nan, ..., -0.95, nan, nan], dtype=float32)
- nino4(time)float32nan nan nan nan ... -0.73 nan nan
- name :
- nino4
- long_name :
- NINO4
- units :
- dimensionless
- description :
- Nino 4 Anom Index using ersstv5 from CPC https://psl.noaa.gov/data/climateindices/list/for info
array([ nan, nan, nan, ..., -0.73, nan, nan], dtype=float32)
- oni(time)float32nan nan nan nan ... nan nan nan
- name :
- oni
- long_name :
- ONI
- units :
- dimensionless
- description :
- ONI from CPC Provided by NOAA/PSL From http://www.cpc.ncep.noaa.gov/data/indices/oni.ascii.txt As of 09/20/2015, uses NOAA ERSST V5 from V3 represents 3 month running mean of ERSST.v5 SST anomalies in the Niño 3.4 region (5N-5oS, 120o-170oW)]
array([nan, nan, nan, ..., nan, nan, nan], dtype=float32)
- tni(time)float320.454 0.047 -0.135 ... nan nan nan
- name :
- tni
- long_name :
- TNI
- units :
- dimensionless
- description :
- TNI Nina 1.2-Nino4 standardized HadSST1.1 until Nov 1981 and and NCEP NOAA OI after Reference: Indices of El Nino Evolution Kevin E. Trenberth, and David P. Stepaniak J. Climate, 14, 1697-1701. From NOAA PSL: See url for latest info https://psl.noaa.gov/data/climateindices/List/#TNI
array([ 0.454, 0.047, -0.135, ..., nan, nan, nan], dtype=float32)
- soi(time)float32nan nan nan nan ... 1.3 1.2 nan nan
- name :
- soi
- long_name :
- SOI
- units :
- dimensionless
- description :
- SOI Index from CPC https://psl.noaa.gov/data/climateindices/list/for info
array([nan, nan, nan, ..., 1.2, nan, nan], dtype=float32)
- meiv2(time)float32nan nan nan nan ... -1.47 nan nan
- name :
- meiv2
- long_name :
- MEIV2
- units :
- dimensionless
- description :
- Multivariate ENSO Index Version 2 (MEI.v2) https://www.psl.noaa.gov/enso/mei Row values are 2 month seasons (YEAR DJ JF FM MA AM MJ JJ JA AS SO ON ND)
array([ nan, nan, nan, ..., -1.47, nan, nan], dtype=float32)
- best(time)float320.26 0.43 0.72 ... -1.04 nan nan
- name :
- best
- long_name :
- BEST
- units :
- dimensionless
- description :
- BEST: Bivariate enso timeserieshttps://psl.noaa.gov/psd/data/climateindices/from NOAA/ESRL PSL
array([ 0.26, 0.43, 0.72, ..., -1.04, nan, nan], dtype=float32)
- hurr(time)float320.0 0.0 0.0 0.0 ... nan nan nan nan
- name :
- hurr
- long_name :
- HURR
- units :
- dimensionless
- description :
- Number of days with hurricane in Atlantic From Phil Klotzbach stored Jan 2 2018 NOAA/ESRL PSL https://psl.noaa.gov/
array([ 0., 0., 0., ..., nan, nan, nan], dtype=float32)
- prcp(time)float32nan nan nan nan ... -0.5527 nan nan
- name :
- prcp
- long_name :
- PRCP
- units :
- dimensionless
- description :
- ESPI From UMD http://eagle1.umd.edu/GPCP_ICDR/Data/ESPI.txt Stored at NOAA/PSL Values are now based on V2.3 updated with new values from source Nov 2021 Older values subject to change
array([ nan, nan, nan, ..., -0.55268, nan, nan], dtype=float32) - pacwarm(time)float32-0.622 -0.549 -0.716 ... nan nan
- name :
- pacwarm
- long_name :
- PACWARM
- units :
- dimensionless
- description :
- PACWARMPOOL ERSSTV5 02/28/2021 /home/csmith/ Timeseries output created at NOAA/ESRL PSL 60E-170E; 15S-15N area average anomalies Climo is 1981 to 2010
array([-0.622, -0.549, -0.716, ..., 0.449, nan, nan], dtype=float32)
[5]:
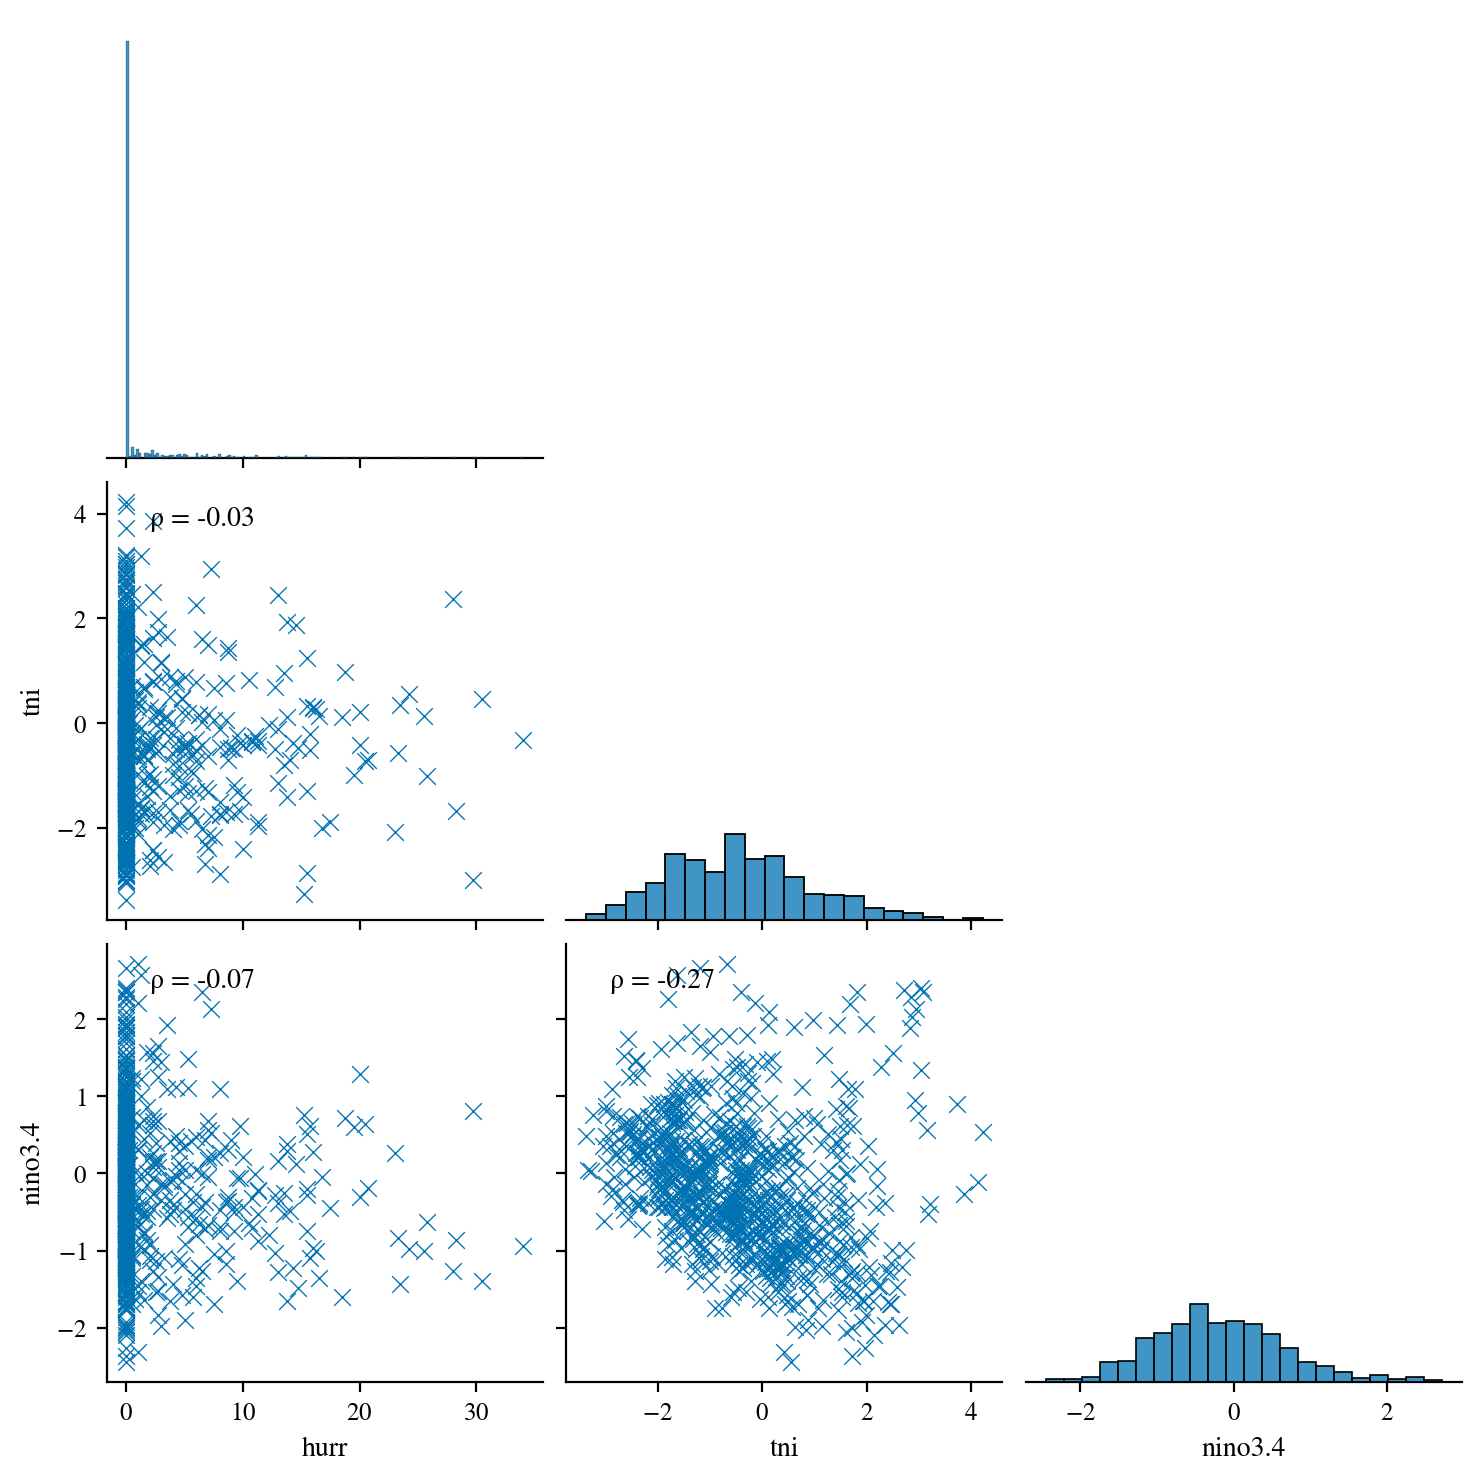
pairplot(psl_df[["hurr", "tni", "nino3.4"]])
/home/users/sithom/seager19/env/lib/python3.8/site-packages/seaborn/relational.py:651: UserWarning: You passed a edgecolor/edgecolors ('w') for an unfilled marker ('x').  Matplotlib is ignoring the edgecolor in favor of the facecolor.  This behavior may change in the future.
  points = ax.scatter(*args, **kws)
[6]:
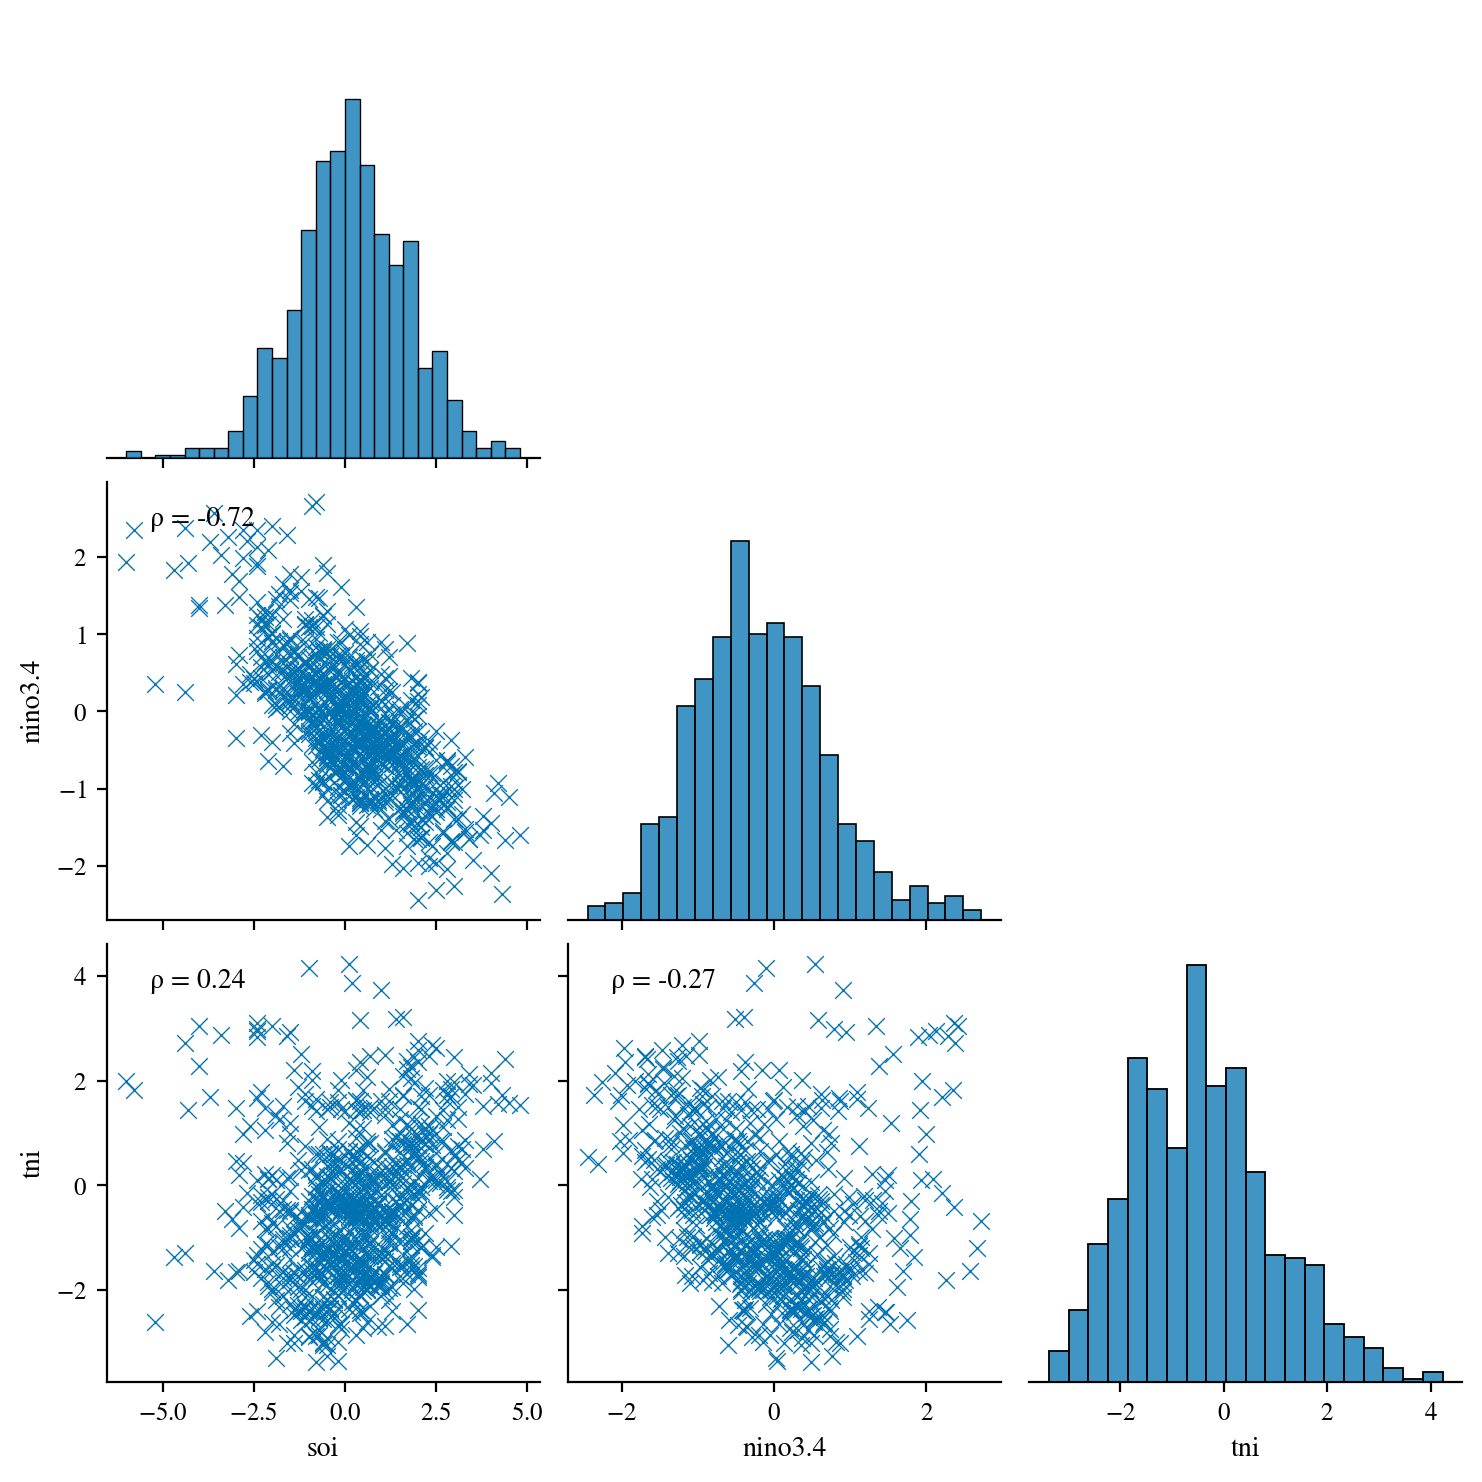
pairplot(psl_df[["soi", "nino3.4", "tni"]])
/home/users/sithom/seager19/env/lib/python3.8/site-packages/seaborn/relational.py:651: UserWarning: You passed a edgecolor/edgecolors ('w') for an unfilled marker ('x').  Matplotlib is ignoring the edgecolor in favor of the facecolor.  This behavior may change in the future.
  points = ax.scatter(*args, **kws)
Download ERSSTV5
[7]:
# Dowload ERSSTV5 reanalysis product from which psl sea surface indices are calculated
ersstv5 = get_ersstv5()
ersstv5_slim = ersstv5.sel(time=slice("1948", "2021"))
ersstv5_can = fix_calendar(can_coords(ersstv5_slim)).isel(variable=0)
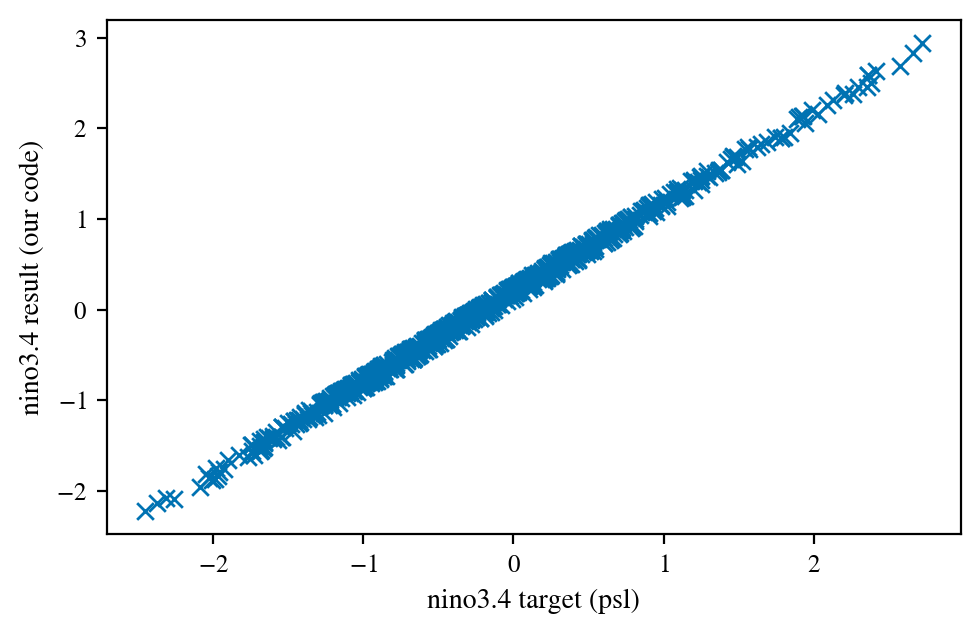
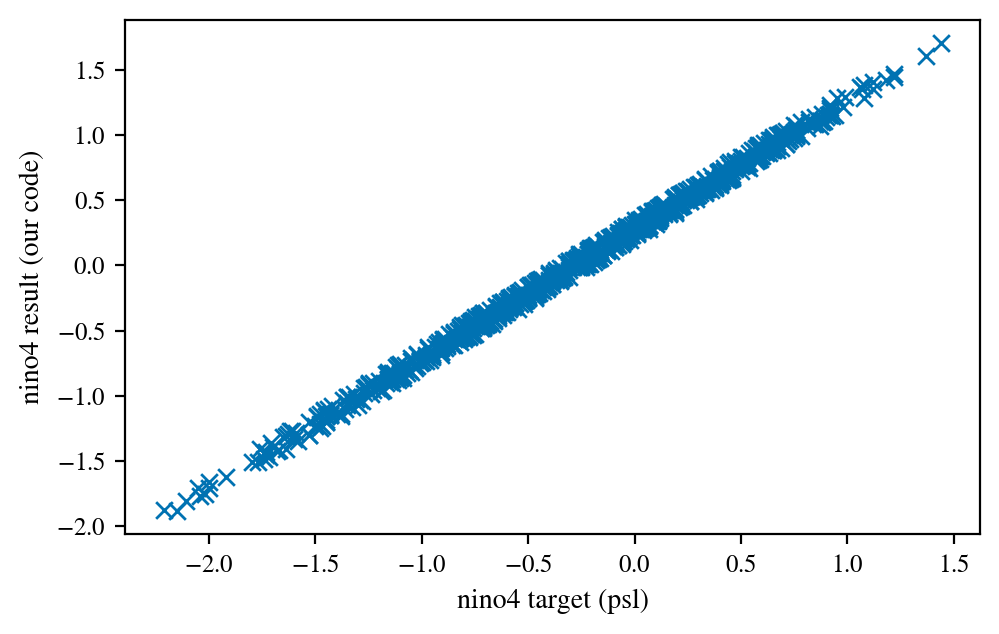
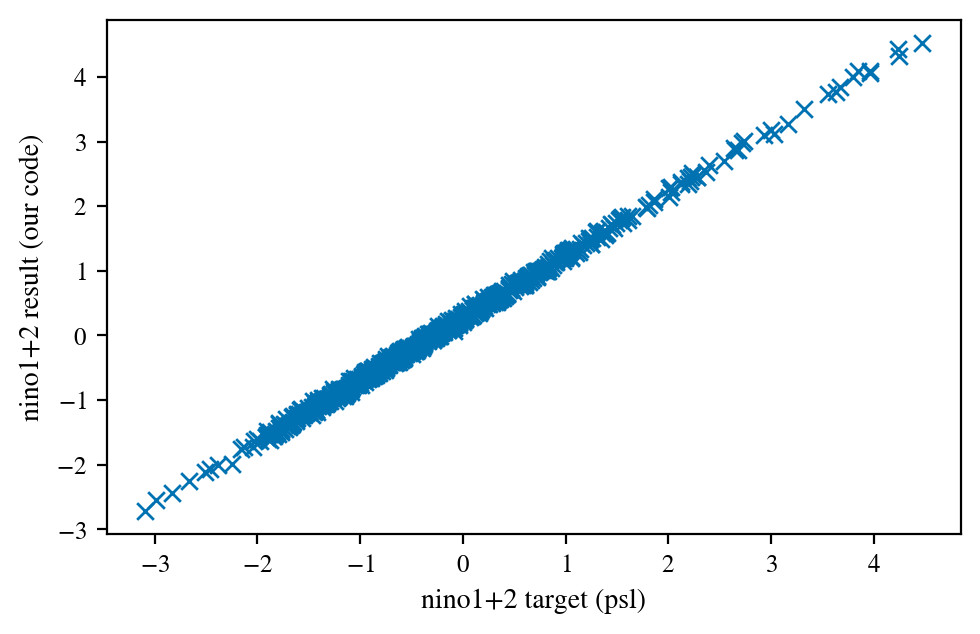
Compare PSL indices against our index calculations
[8]:
for i in [
    "nino3.4",
    "nino3",
    "nino4",
    "nino1+2",
]:
    my_nino_da, climatology_da = nino_calculate(ersstv5_can, reg=i, roll_period=1)
    my_nino = my_nino_da.values
    psl_nino = psl_ds[i].sel(time=slice("1948", "2021-10")).values
    comp_seq(i, psl_nino, my_nino)
===== nino3.4 =====
correlation matrix [[1.0 0.998794655697617]
 [0.998794655697617 1.0]]
slope: 0.9953671071300163
intercept: 0.20171243976213266
r_value: 0.9987946556976167
p_value: 0.0
std_err: 0.0016680055790584797
==================
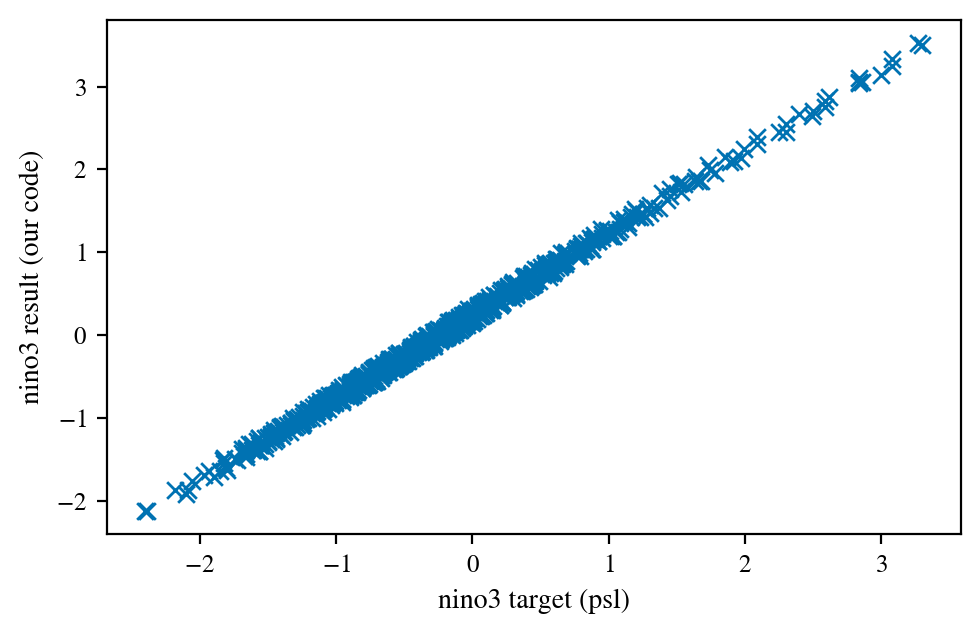
===== nino3 =====
correlation matrix [[1.0 0.9983586329289734]
 [0.9983586329289734 1.0]]
slope: 0.995138089242093
intercept: 0.24110258121849562
r_value: 0.998358632928974
p_value: 0.0
std_err: 0.0019466466185894748
==================
===== nino4 =====
correlation matrix [[1.0 0.9984668609648092]
 [0.9984668609648092 1.0]]
slope: 0.9877885417259548
intercept: 0.2758879118231335
r_value: 0.998466860964809
p_value: 0.0
std_err: 0.00186732688227996
==================
===== nino1+2 =====
correlation matrix [[1.0 0.9992073362076906]
 [0.9992073362076906 1.0]]
slope: 0.9648830615246707
intercept: 0.2757369748548087
r_value: 0.9992073362076904
p_value: 0.0
std_err: 0.0013108206415181742
==================
<Figure size 1102.36x681.297 with 0 Axes>