Plot Utils example usage
[1]:
# Convenient jupyter setup
%load_ext autoreload
%autoreload 2
%config IPCompleter.greedy=True
[7]:
%matplotlib inline
[ ]:
import numpy as np
import matplotlib.pyplot as plt
[4]:
from src.plot_utils import (
            ps_defaults,
            label_subplots,
            get_dim,
            set_dim,
            PALETTE,
            STD_CLR_LIST,
            CAM_BLUE,
            BRICK_RED,
            OX_BLUE,
        )
ps_defaults()
[12]:
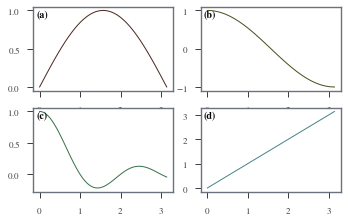
def four_panel_plot():
    fig, axs = plt.subplots(2, 2)

    x = np.linspace(0, np.pi, num=100)
    axs[0, 0].plot(x, np.sin(x), color=STD_CLR_LIST[0])
    axs[0, 1].plot(x, np.cos(x), color=STD_CLR_LIST[1])
    axs[1, 0].plot(x, np.sinc(x), color=STD_CLR_LIST[2])
    axs[1, 1].plot(x, np.abs(x), color=STD_CLR_LIST[3])

    # set size
    set_dim(fig, fraction_of_line_width=1, ratio=(5 ** 0.5 - 1) / 2)
    return axs
[13]:
# label subplots
axs = four_panel_plot()
label_subplots(axs, start_from=0, fontsize=10)
plt.show()

[21]:
# label subplots
axs = four_panel_plot()
label_subplots(axs, start_from=0, fontsize=10, override="outside")
plt.show()

[22]:
# label subplots
axs = four_panel_plot()
label_subplots(axs, start_from=0, fontsize=10, override="inside")
plt.show()
[ ]: